Content Warning

@VRubinObs 🔭 Today, #astronomers are aware of only about 40 percent 📊 of potentially hazardous #asteroids ☄️ - close-flying objects that are large enough to cause continent-wide destruction if they were to impact 💥 Earth. "The idea is, if there is an object like that, we want to find it while it’s maybe 40 or 50 years out, because that gives us enough time to figure out how we’re going to deflect it.” https://www.smithsonianmag.com/science-nature/this-revolutionary-new-observatory-will-locate-threatening-asteroids-and-millions-of-galaxies-180984514/

#Observatory#Astronomy#AsteroidThreat

Content Warning

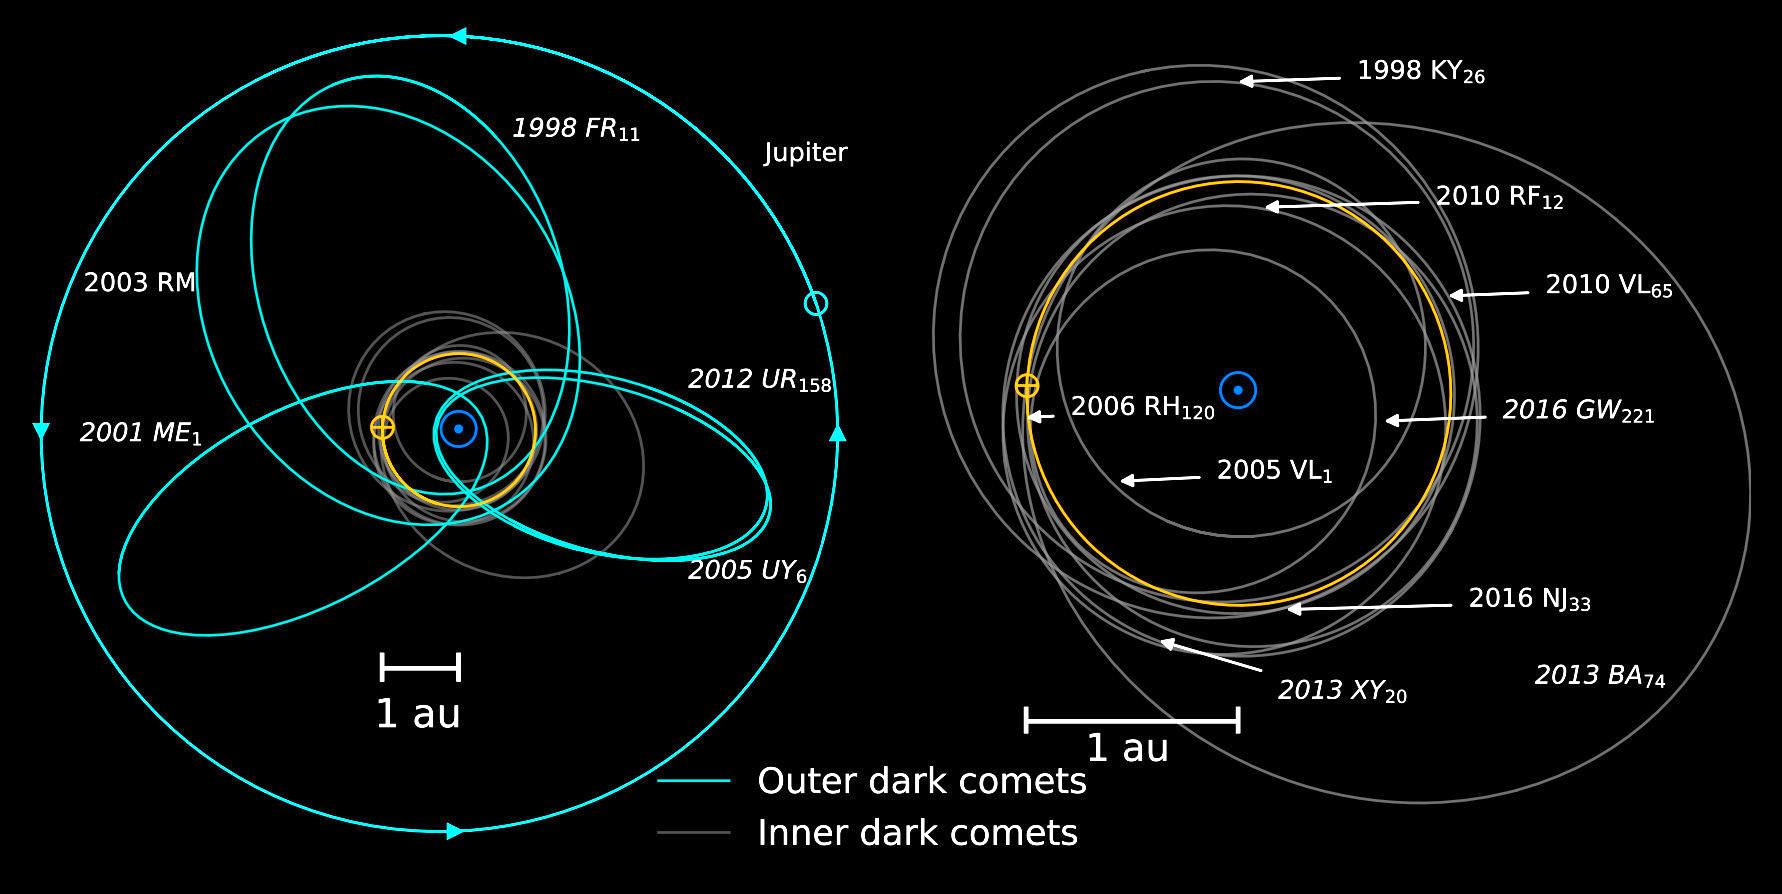
Intriguing "hey, that's weird" discovery: Astronomers have found 14 asteroids that seeming move under their own power.

These objects are classified as "dark comets." Presumably they are emitting puffs of gas that shifts their orbits. But ...so far, nobody can spot any sign of activity.

https://www.nasa.gov/solar-system/comets/nasa-researchers-discover-more-dark-comets/ #space #science #astronomy #nature

Content Warning

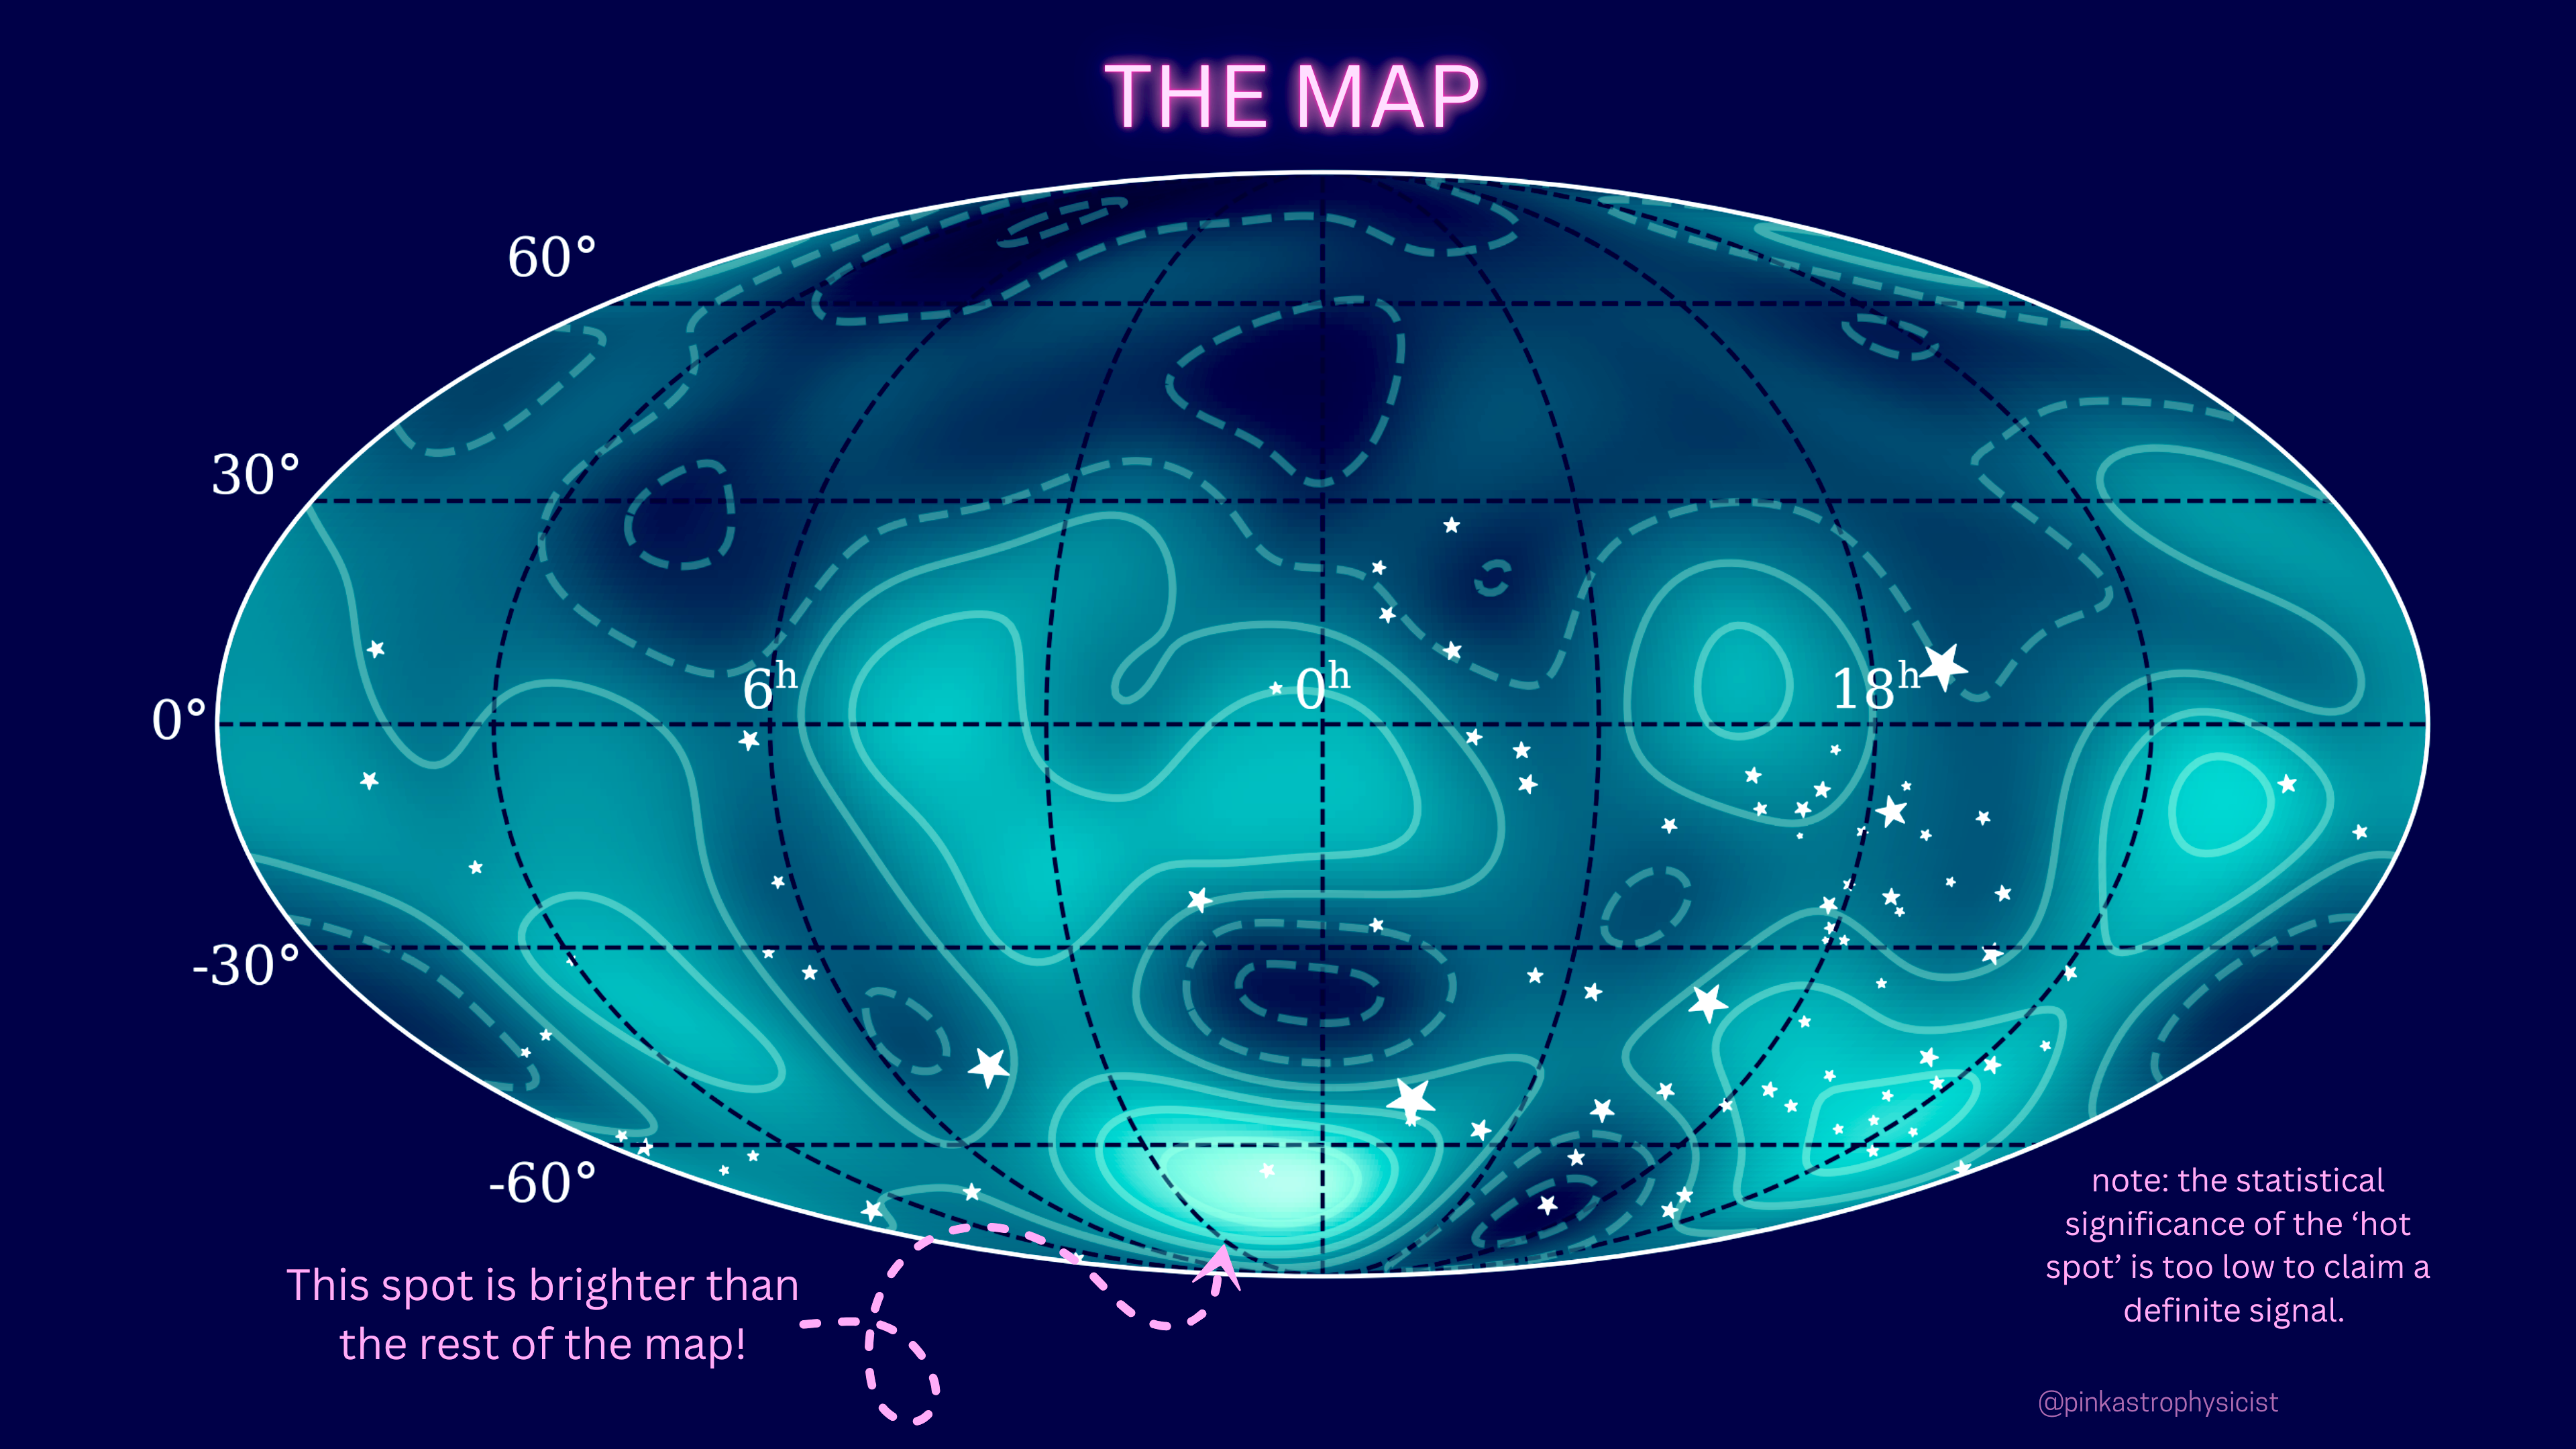
Astronomers are closing in on a radically new kind of cosmic map--a map that shows the universe in gravitational waves.

The process is hard. This new, preliminary version is uncertain. But we're seeing a fresh view of reality come into focus.

https://www.spaceaustralia.com/feature/mapping-gravitational-wave-universe #space #science #astronomy #nature

Content Warning

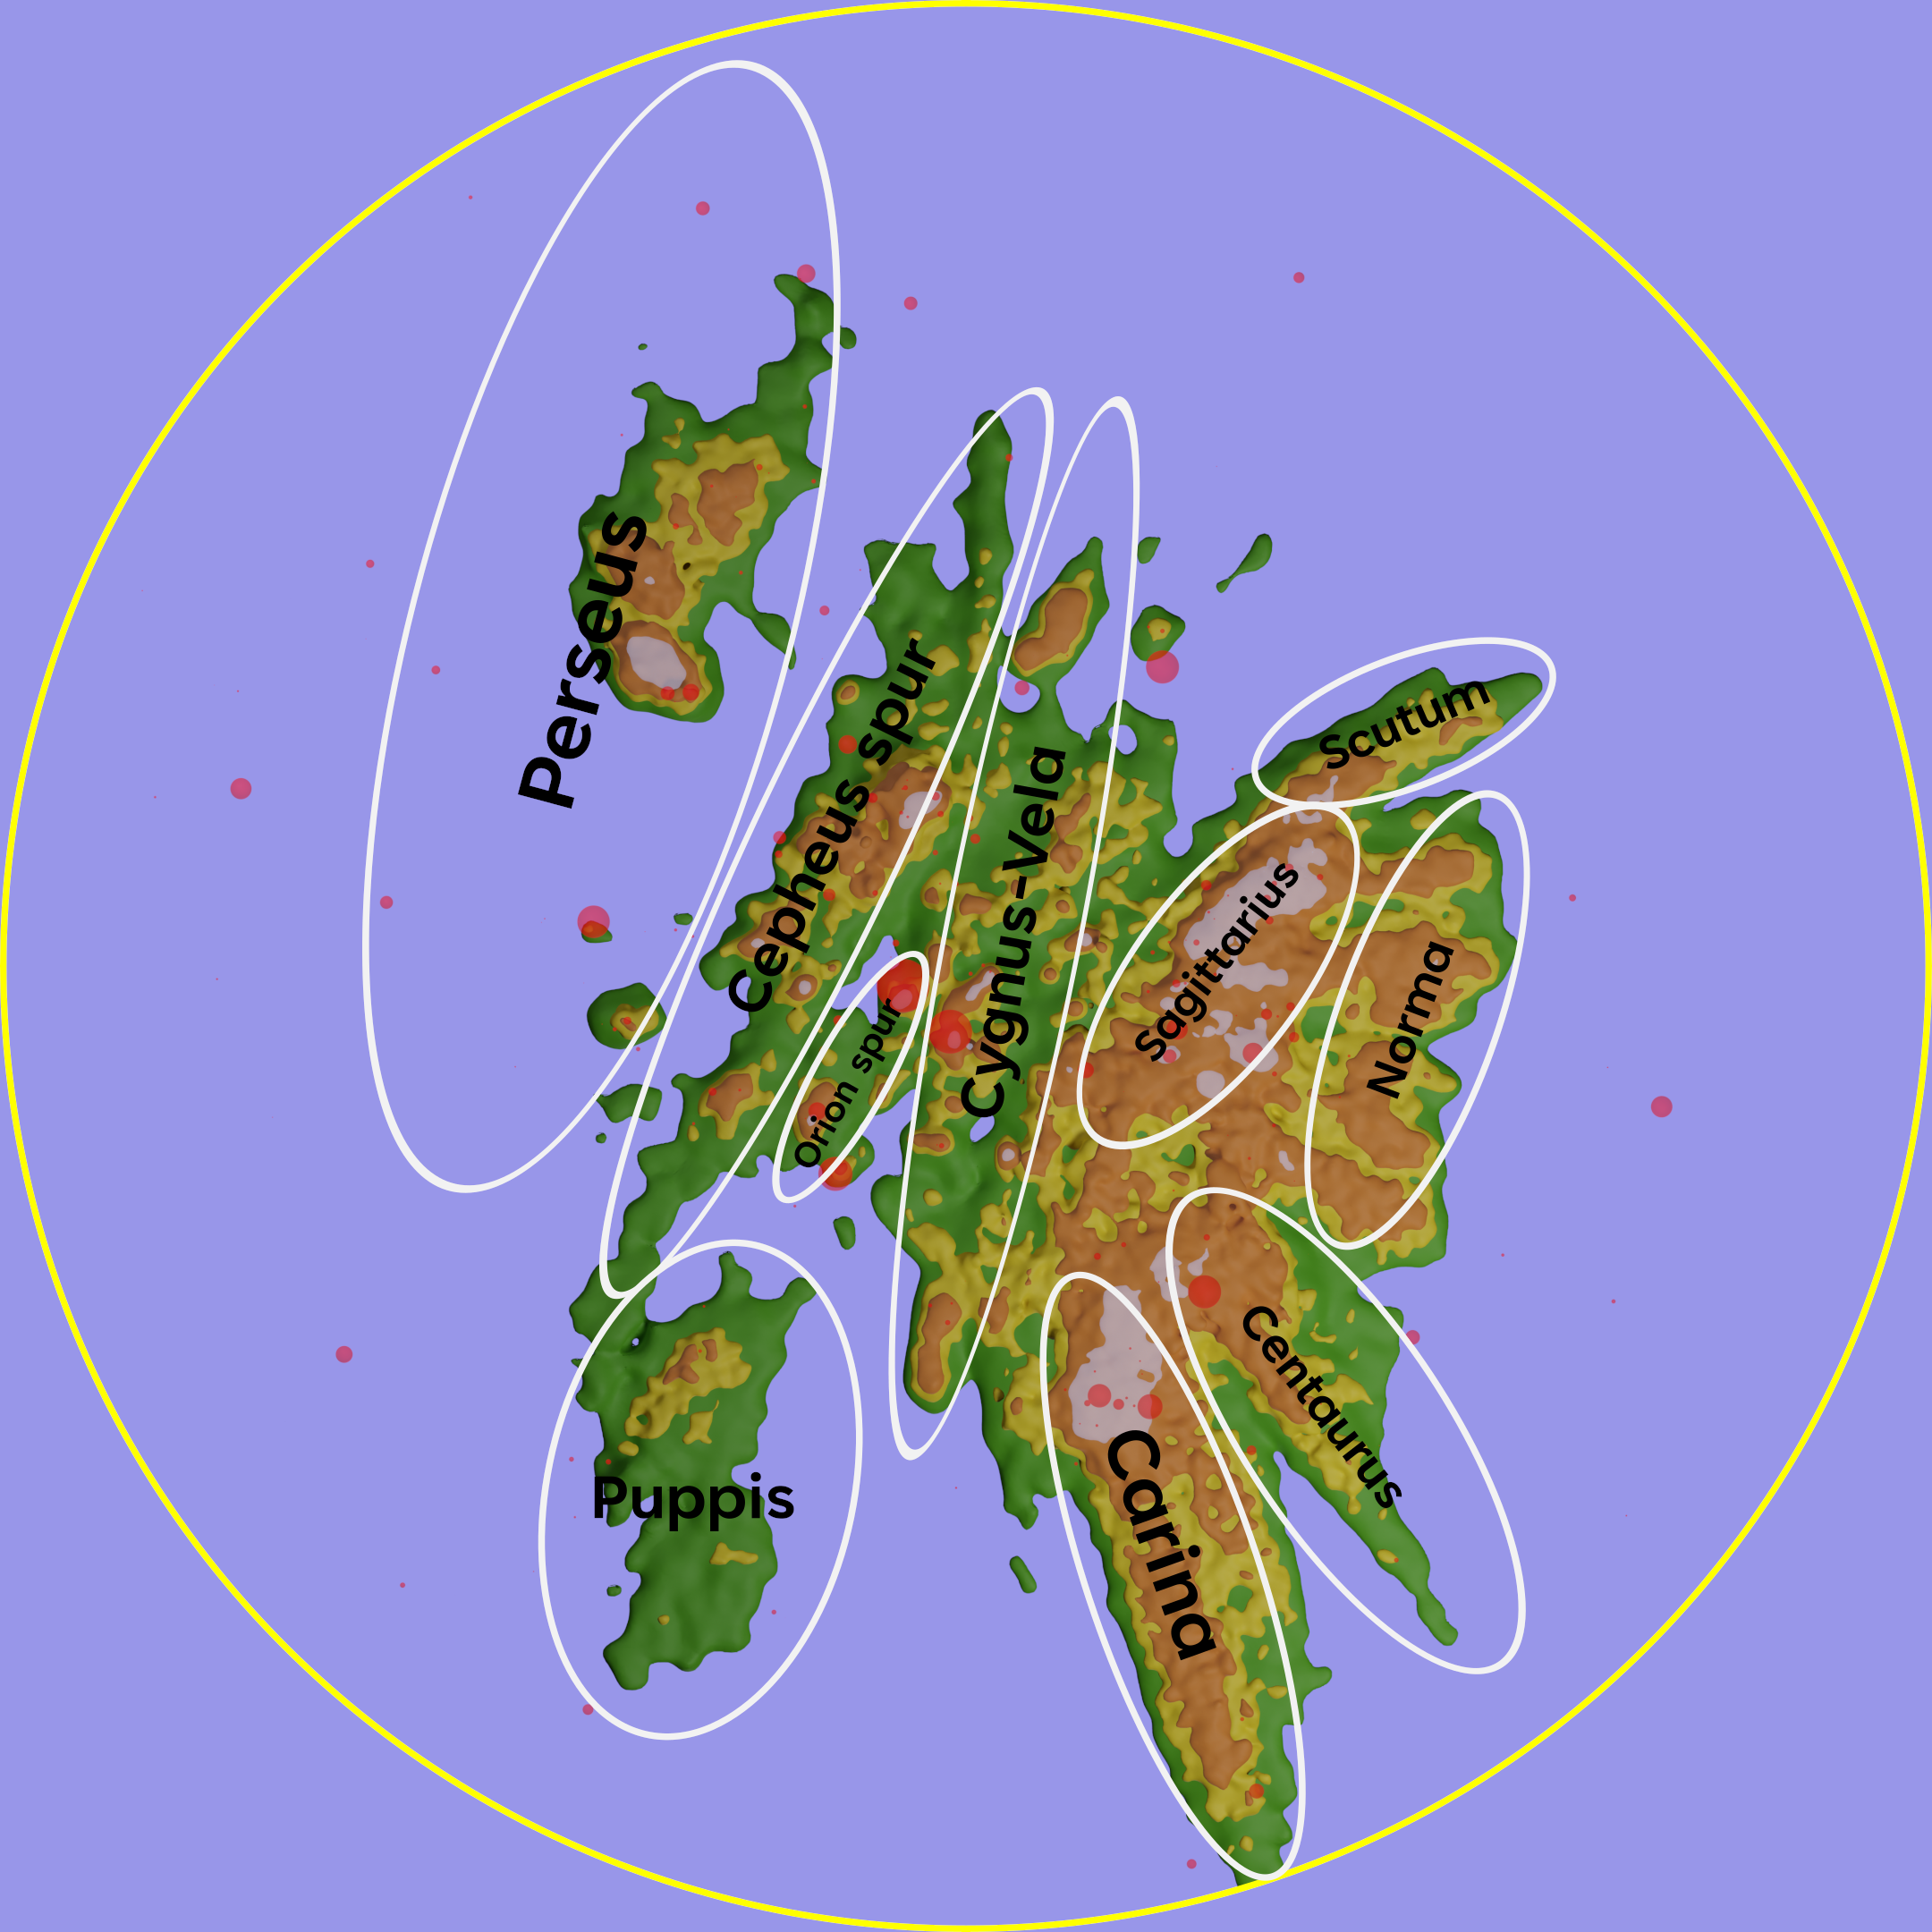
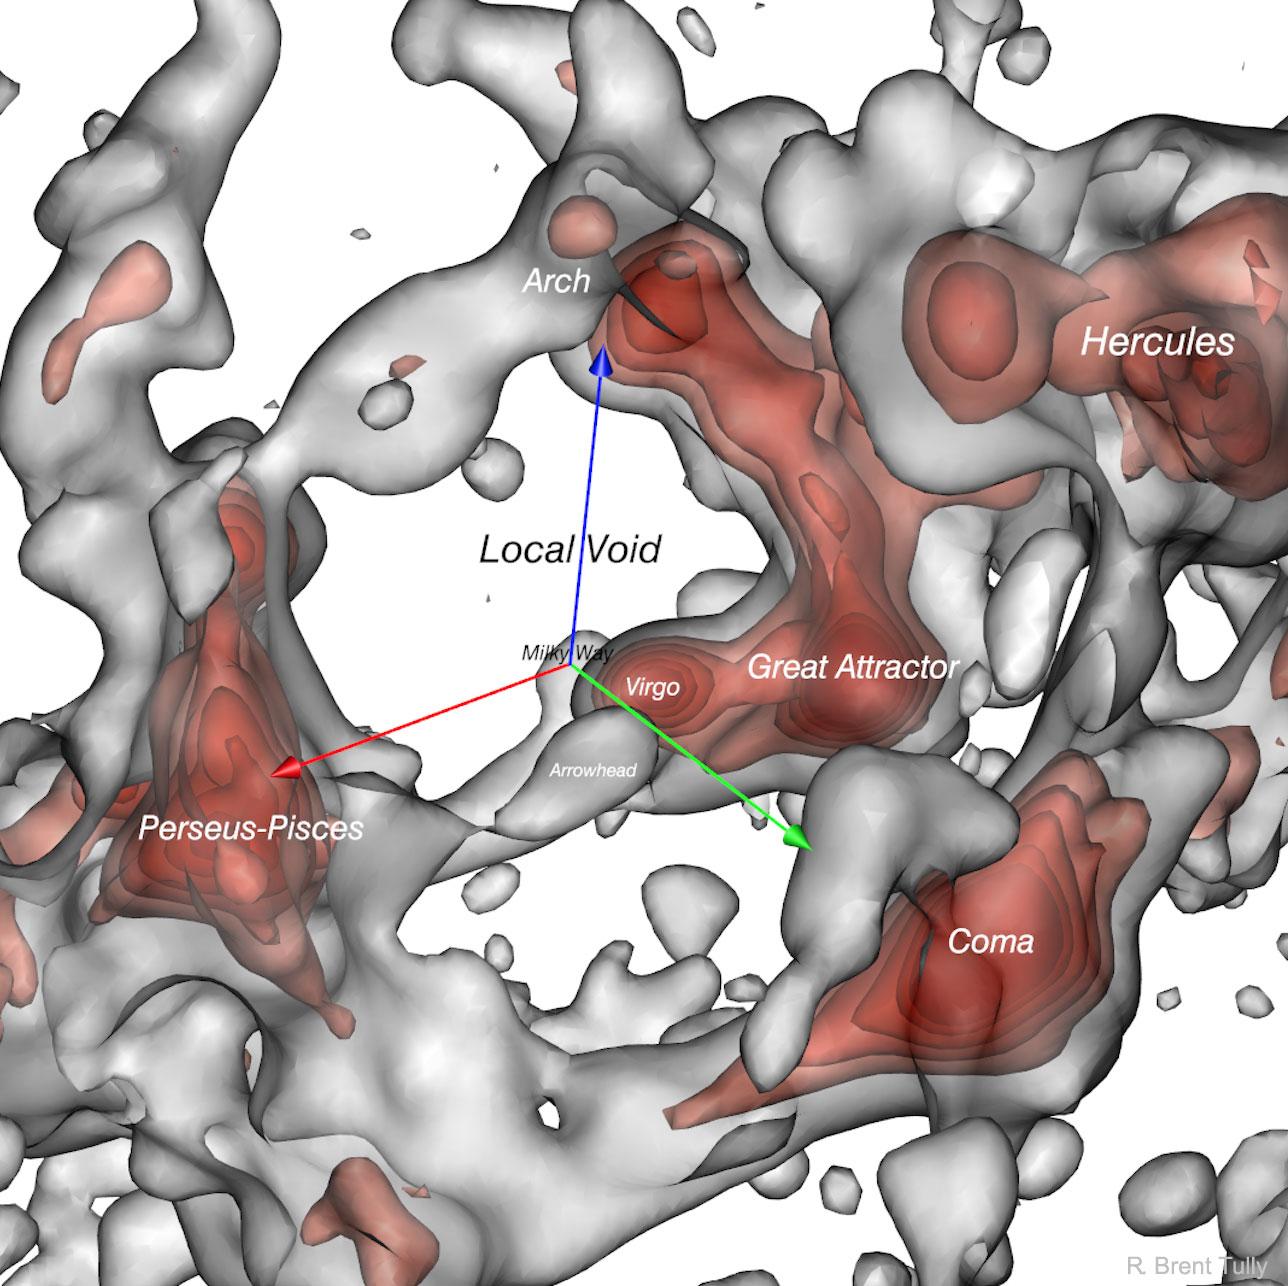
A map of the structure surrounding the Local Void

In this map our Milky Way galaxy lies at the origin of the red-green-blue orientation arrows, each 200 million lightyears in length.

☑️ this is Fig.1 of https://ui.adsabs.harvard.edu/abs/2019ApJ...880...24T/abstract
☑️ more insights by APOD: https://apod.nasa.gov/apod/ap190806.html

#Cosmology#Cosmography#LocalVoid#APOD#GreatAttractor #map #astronomy #astrophysics#astrodon #science#STEM#MilkyWay #galaxy #galaxies#CosmicWeb

a cosmographic map featuring the cosmological large scale structure in our local cosmic neighborhood. The density field is displayed as semi-transparent isosurfaces, colored grey for the the lower isocontour value, and colored in nuances of red for five higher levels. The resulting structure is filamentary, with high-density knots at the filaments' crossing, an architecture typical of the Cosmic Web. Three colored arrows materialize the cardinal axes of the Supergalactic Coordiante System, centered at our location. Several important actors of our local cosmography are named: Milky Way, Virgo, Arrowhead, Great Attractor, Perseus-Pisces, Coma, Arch, Hercules. The name of the astronomer leading the study is inprinted in the lower right corner of the figure, reading R. Brent Tully. All these elements are drawn against a white background.

Content Warning

Cosmography archives

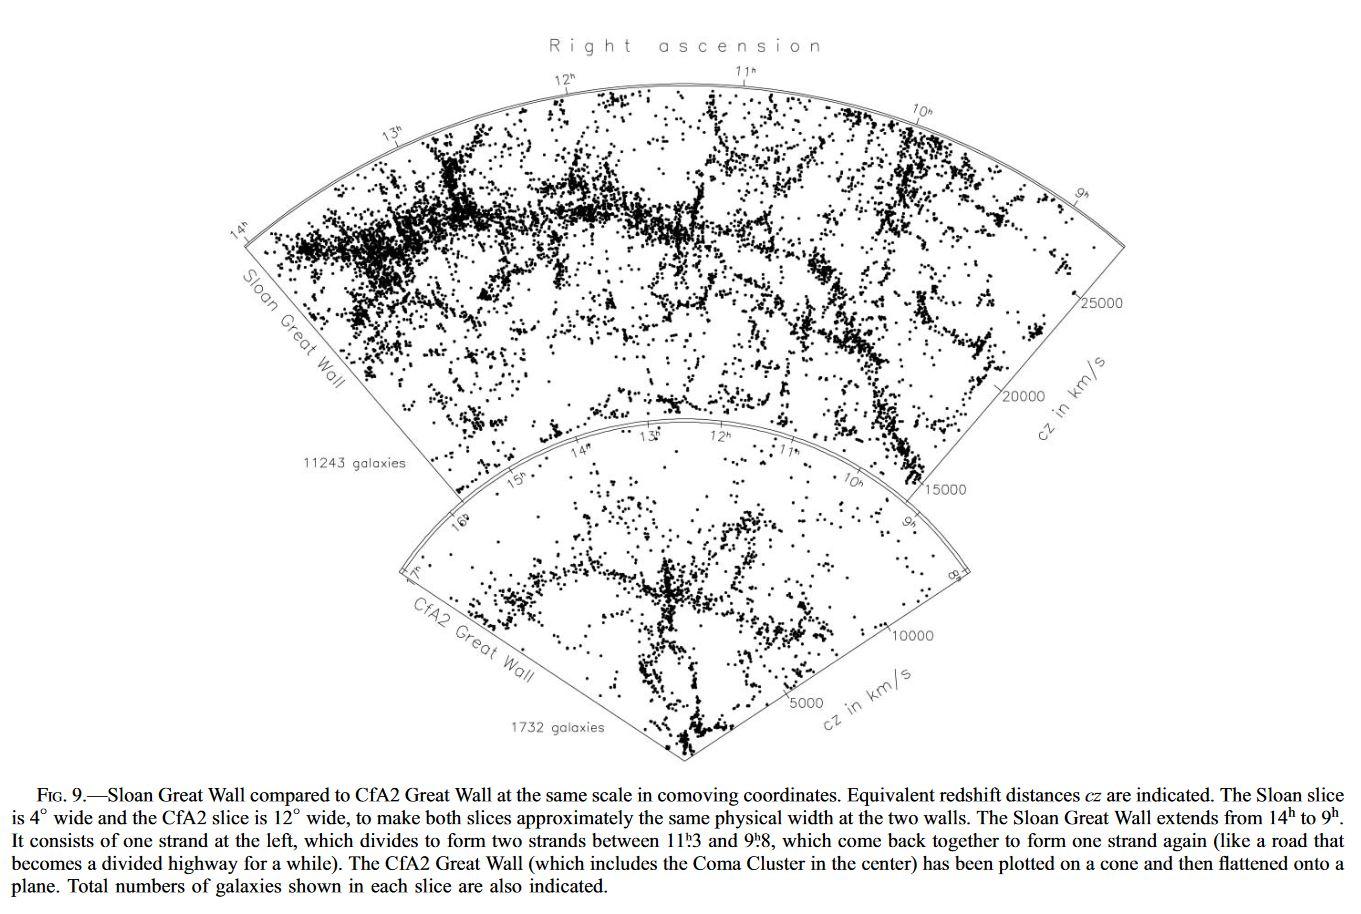
2005: Discovery of the Sloan Great Wall

by J. Richard Gott and co-authors
https://doi.org/10.1086/428890

At the time of its discovery, this 1.37 billion light-years long filament is the largest observed structure in the Universe.

#Cosmology #galaxies#SloanGreatWall#Cosmography #archives #archive#CosmographyArchives #history #science#HistoryOfScience #Astrodon #astrophysics #astronomy #physics#STEM#Universe#CosmicWeb

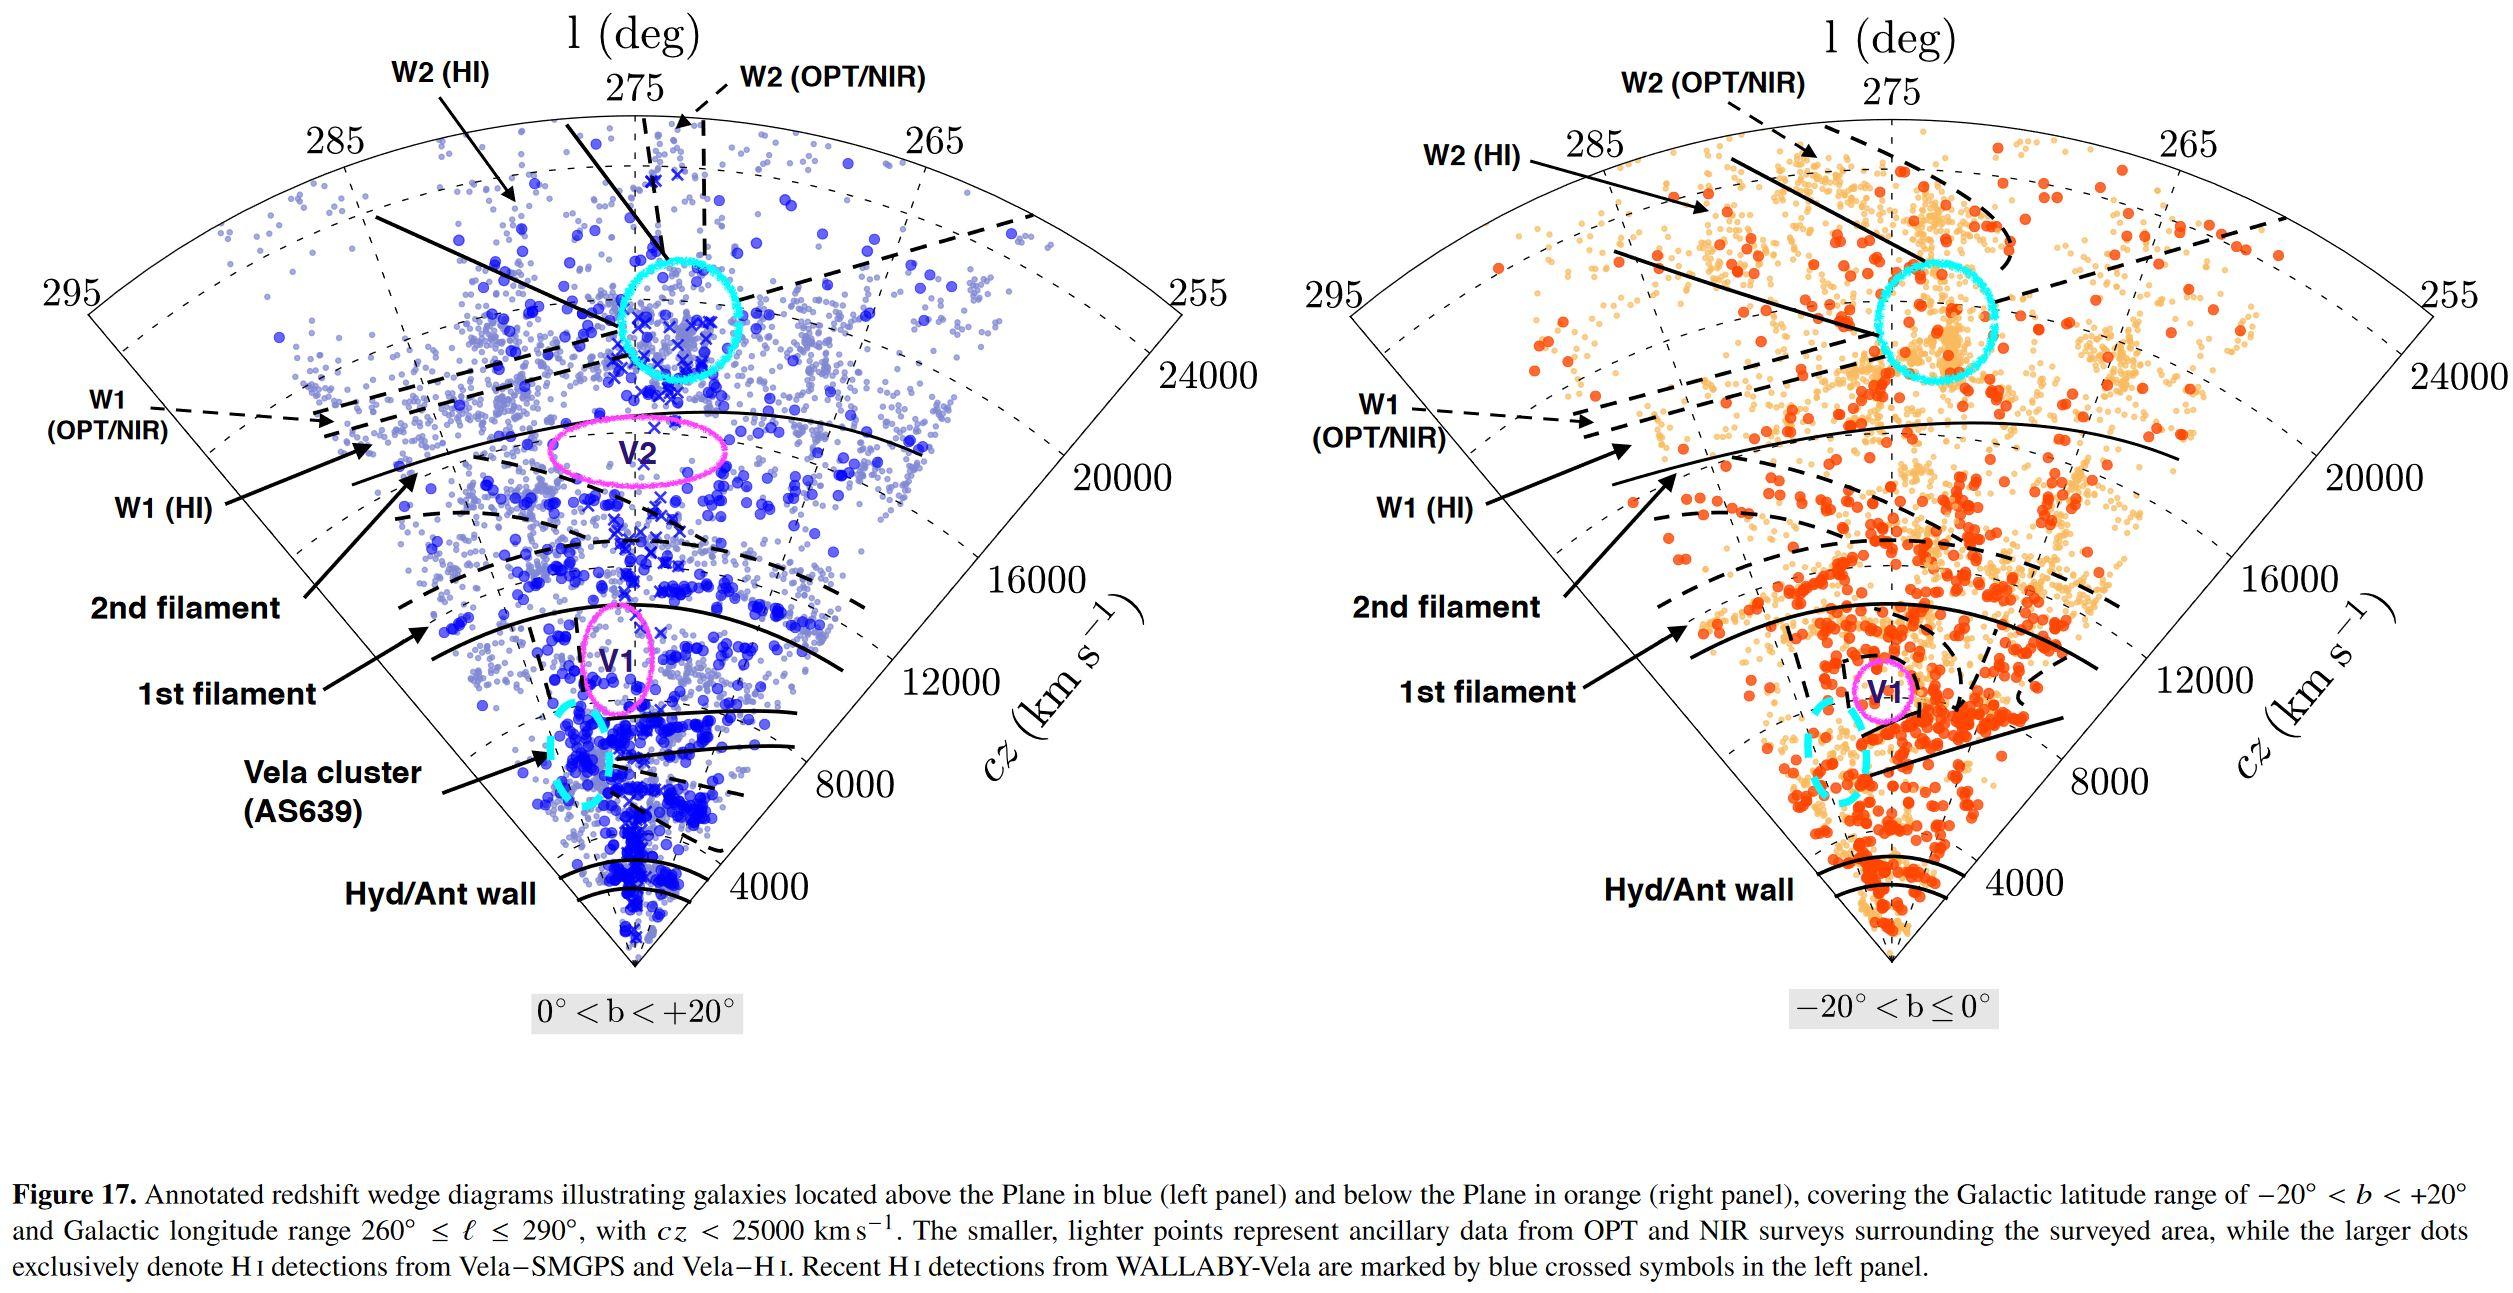
The distribution of galaxies obtained with the Sloan Digital Sky Survey and displayed as two fan-shaped plots with Right Ascension versus redshift distances as coordinates. Galaxies' positions are shown as black points on a white background, featuring filamentary structures typical of the Cosmic Web, which describes the large-scale structure of the Universe. The two fan-shaped plots lie on top of each other, with their boundaries elegantly matching each other's. On the lower plot, running from 0 to 14000 km/s in redshift, and from 8  to 17 hours in Right Ascension, is shown the CfA2 Great Wall, with its iconic stickman-shaped distribution of galaxies. On the higher plot, running from 14000 to 28000 km/s in redshift distances, and from about 9 to 14 hours in Right Ascension, is featured the Sloan Great Wall. A caption completes this figure.
The distribution of galaxies obtained with the Sloan Digital Sky Survey and displayed as two fan-shaped plots with Right Ascension versus redshift distances as coordinates. Galaxies' positions are shown as black points on a white background, featuring filamentary structures typical of the Cosmic Web, which describes the large-scale structure of the Universe. The two fan-shaped plots lie on top of each other, with their boundaries elegantly matching each other's. On the lower plot, running from 0 to 14000 km/s in redshift, and from 8 to 17 hours in Right Ascension, is shown the CfA2 Great Wall, with its iconic stickman-shaped distribution of galaxies. On the higher plot, running from 14000 to 28000 km/s in redshift distances, and from about 9 to 14 hours in Right Ascension, is featured the Sloan Great Wall. A caption completes this figure.

Content Warning

NASA's visualization team created a beautiful preview of every phase of the Moon in 2025, hour by hour.

The best part: Watching how the Moon's appearance changes due to its inclination, oval orbit, and libration (wobble).

https://svs.gsfc.nasa.gov/5415 #science #nature #nasa #astronomy #space

The phase and libration of the Moon for 2025, at hourly intervals. Includes supplemental graphics that display the Moon's orbit, subsolar and sub-Earth points, and the Moon's distance from Earth at true scale. Craters near the terminator are labeled, as are Apollo landing sites, maria, and other albedo features in sunlight.